
For years, the message has been to "eat real food." It sounds simple, but the real challenge is figuring out what that actually means—and how official guidelines define it. With the release of the new 2026 Dietary Guidelines, there has been a surprising shake-up. The initial expectation was the worst. But as it turns out, some parts of these new recommendations are genuinely encouraging—others, not so much.
Here is a breakdown of what the new guidelines get right, where they go wrong, and what it all means for health.
Table of Contents
- What's This About a New Pyramid?
- The Good Aspects of the New Guidelines
- Problems With the New Guidelines
- References
What's This About a New Pyramid?
The food pyramid has been inverted in the new dietary guidelines—a change that has drawn considerable attention and debate.

While many observers were initially concerned that these new guidelines would represent a step backward, there are some very encouraging aspects—alongside areas that remain problematic.
The Good Aspects of the New Guidelines
Starting with what has gone right—and then examining what is less ideal—helps provide a fair assessment. Every new iteration of the dietary guidelines should build upon and improve what has come before.
The original food pyramid had major issues, such as being too grain-heavy and minimizing healthy unsaturated fats like extra-virgin olive oil [1].

So in 2011, it was scrapped for MyPlate, which was a huge improvement [2].

These new 2026 guidelines don't replace the old food pyramid. This is a really important point. They replace MyPlate.
MyPlate focused on whole, unprocessed foods, and these new guidelines build upon that base and keep whole foods as their focus.
This is evident in the introduction to the guidelines. The central message is: Eat real food. The guidance goes on to say that we should prioritize whole, nutrient-dense foods and whole grains [3].
Whole grains? The new guideline diagram has whole grains at the bottom, where it looks like they should be minimized. So should people be prioritizing whole grains or reducing intake? More on that shortly, because that is one of the areas that hasn't gone right.
Coming back to what has gone right: one aspect that wasn't given enough attention in the MyPlate guidelines was protein intake. Its protein guidance was based on the RDA of 0.8 g/kg/day [4].
But is that really an adequate amount?
The trend toward higher protein recommendations has been hard to miss. Protein shakes, bars, and snacks are everywhere. So is that 0.8 g/kg/day figure too low?
There are several reasons higher protein intake can benefit health.
For instance, muscle mass is a key concern as we get older. Muscle loss begins as early as the 30s, and the loss accelerates with age—particularly during times of illness and bed rest. Muscle mass can decrease by as much as 50% between the ages of 40 and 80. Strength is connected to mass and drops rapidly, too [5].
These declines reduce mobility, diminish quality of life, and can lead to fall-related injuries that require costly hospitalization and extended rehabilitation [6].
The crucial question is whether 0.8 g/kg/day is enough to maintain and rebuild muscle mass as we age. An international group of experts has urged a higher target of 1.0 to 1.2 g/kg/day for healthy individuals over 65 [5].
And the evidence supports this. In one observational study, older adults (aged 70–79) who consumed around 1.1 g/kg/day lost 40% less lean body mass over 3 years compared to those eating closer to 0.8 g/kg/day [5].
And since muscle loss begins early, it would make sense to raise protein intake when younger, to a level that maximizes muscle gains. Sarcopenia—the age-related loss of skeletal muscle mass and strength—is a recognised clinical syndrome that affects physical functioning and independence, making early dietary prevention particularly important.
For muscle building, 1.6 g/kg/day is often cited as a target. That may be high for most people. But a newer meta-analysis found a strong effect up to about 1.3 g/kg/day. Beyond that, benefits plateaued [7].
There is even a modest weight loss benefit from higher protein intake. One meta-analysis found that studies showing this benefit used protein intakes ranging from 1.07 to 1.6 g/kg/day [8]. Higher protein also tends to promote satiety, which can help maintain a healthy body weight over time.
Even the low end of that range is well above 0.8 g/kg/day.
This is where the new guidelines get it right. They recommend 1.2–1.6 g/kg/day, significantly higher than the 0.8 g/kg/day in previous guidelines. They also recognize that protein needs vary based on age, activity level, and individual health status—an important nuance that was absent from prior iterations.

The new guidelines also continue past advice to vary protein sources. A variety is needed, including animal sources as well as things like beans, nuts, and seeds [3].
Many other aspects of the new guidelines are essentially the same as what has come before. The recommendations include eating a variety of colorful, nutrient-dense vegetables and fruits [3].

Avoiding sugar-sweetened drinks and added sugars is also emphasized [3].

And sodium intake should be kept below 2,300 mg/day [3].

Problems With the New Guidelines
There are three areas where the new dietary guidelines have significant problems.
1. Confusing Guidance on Fats
This is an area where there was a lot of speculation before the guidelines were released. Many expected that they would remove any language warning against saturated fats. At the press conference announcing the new guidelines, RFK Jr. declared they were "ending the war on saturated fats" [9].

In the scientific report published along with the new guidelines, there is an extensive discussion of the evidence about saturated fats. It argues there is no good evidence that lowering saturated fat consumption lowers cardiovascular risk [10].
The appendices include a new meta-analysis on saturated fat. It specifically challenges the 10% calorie limit that was part of previous guidelines [11].
That 10% figure was indeed used in the prior 2020 guidelines [12].
So what do the new guidelines actually say? This is where it gets confusing. Despite all of this, the guidelines retain the guidance that saturated fat should be limited to no more than 10% of daily calories [3].

At the same time, the emphasis has clearly shifted. The guidelines list sources of "healthy fats" that include meats—likely meaning red meat, since poultry and seafood are separately listed. They also suggest butter and beef tallow as options when cooking [3].

Red meat, butter, and beef tallow are all high in saturated fats. They were not recommended in previous guidelines, and mainstream health advice has consistently been to limit consumption of these foods.
The guidelines also recommend full-fat dairy [3]. This is another departure. The previous guidelines consistently recommended low-fat dairy products [12].

The reason for that earlier recommendation was to reduce saturated fat consumption.
Some evidence of Kennedy's claim to end the war on saturated fat does appear in the guidelines. Red meat, butter, beef tallow, and full-fat dairy are all encouraged.
But this is in tension with the 10% guidance. If meals are centered on animal-based proteins and cooked in beef tallow, it becomes very easy to exceed that threshold. The overall picture is contradictory: limit saturated fats, but also eat foods that are very high in saturated fats.
2. Inconsistent Methodology
The second issue has to do with methodology—and how it appears to be applied inconsistently.
In the scientific report, a rigorous standard for evidence is laid out. It says the guidelines should prioritize randomized, controlled trials over observational studies. Observational studies don't let us make conclusions about causes—they only uncover potential relationships. Randomized controlled trials give much greater confidence that the relationships observed are real [10].

When dealing with dietary guidelines, the stakes are high. They can have a profound impact on the food system and on dietary habits across a population. Recommendations should therefore be grounded in the strongest possible evidence [10].
The report also states it will focus on actual clinical outcomes, instead of surrogate markers. In other words, the goal is to measure how a dietary change affects rates of disease—not just blood cholesterol levels. The reason is that changes in these surrogate markers don't always map onto changes in clinical outcomes in the way one might expect [10].
The authors don't dismiss observational studies or surrogate markers. They acknowledge these have their place. But the stated goal is to anchor dietary guidance in experimentally tested relationships whenever available, using other kinds of evidence for context [10].
This emphasis on randomized controlled trials and clinical outcomes is why the evidence on saturated fat is found unconvincing by the report's authors [11].
But then a different story appears when it comes to highly processed foods. As discussed above, warning against this kind of food is a major theme in the new guidelines.
This raises practical questions. Does that mean people should avoid protein powders? Plain Greek yogurt? Canned beans or lentils?
And there is another problem. With such a strong warning against processed foods, strong randomized controlled trial data focused on clinical outcomes would be expected. But the meta-analysis prepared as part of the scientific foundation admits this isn't the case. Instead, it says the evidence base is almost entirely observational [11].
All of this illustrates how the assumptions brought to the data have a significant impact on the conclusions ultimately drawn. If the authors started with a suspicion of saturated fat—treating it as guilty until proven innocent—the recommendations might have gone in a very different direction.
3. The New Food Pyramid Graphic
One last issue with the new guidelines is the inverted pyramid graphic itself.
The original pyramid was abandoned in 2011 partly because it gave a distorted view of healthy eating. This new pyramid runs a similar risk.
Visually, the image is dominated by a huge steak, a massive chunk of cheese, ground beef, and a whole chicken. There is a lot of saturated fat represented here, and the portion sizes seem inflated. In contrast, super-healthy plant-based protein sources like chickpeas and lentils are nearly invisible—a small pile of beans on top of a bowl of rice that is easy to miss [3].

And the graphic misrepresents what is actually in the guidelines. Whole grains occupy a tiny slice at the bottom, despite the recommendation being 2–4 servings a day—roughly the same as in the MyPlate guidelines. Nothing has really changed here [3].

Finally, just like with the older pyramid, this graphic is not particularly helpful for understanding what a balanced healthy meal actually looks like. "Eat real food" is a great slogan. But the challenge comes in knowing which real foods to eat, and in what proportions.
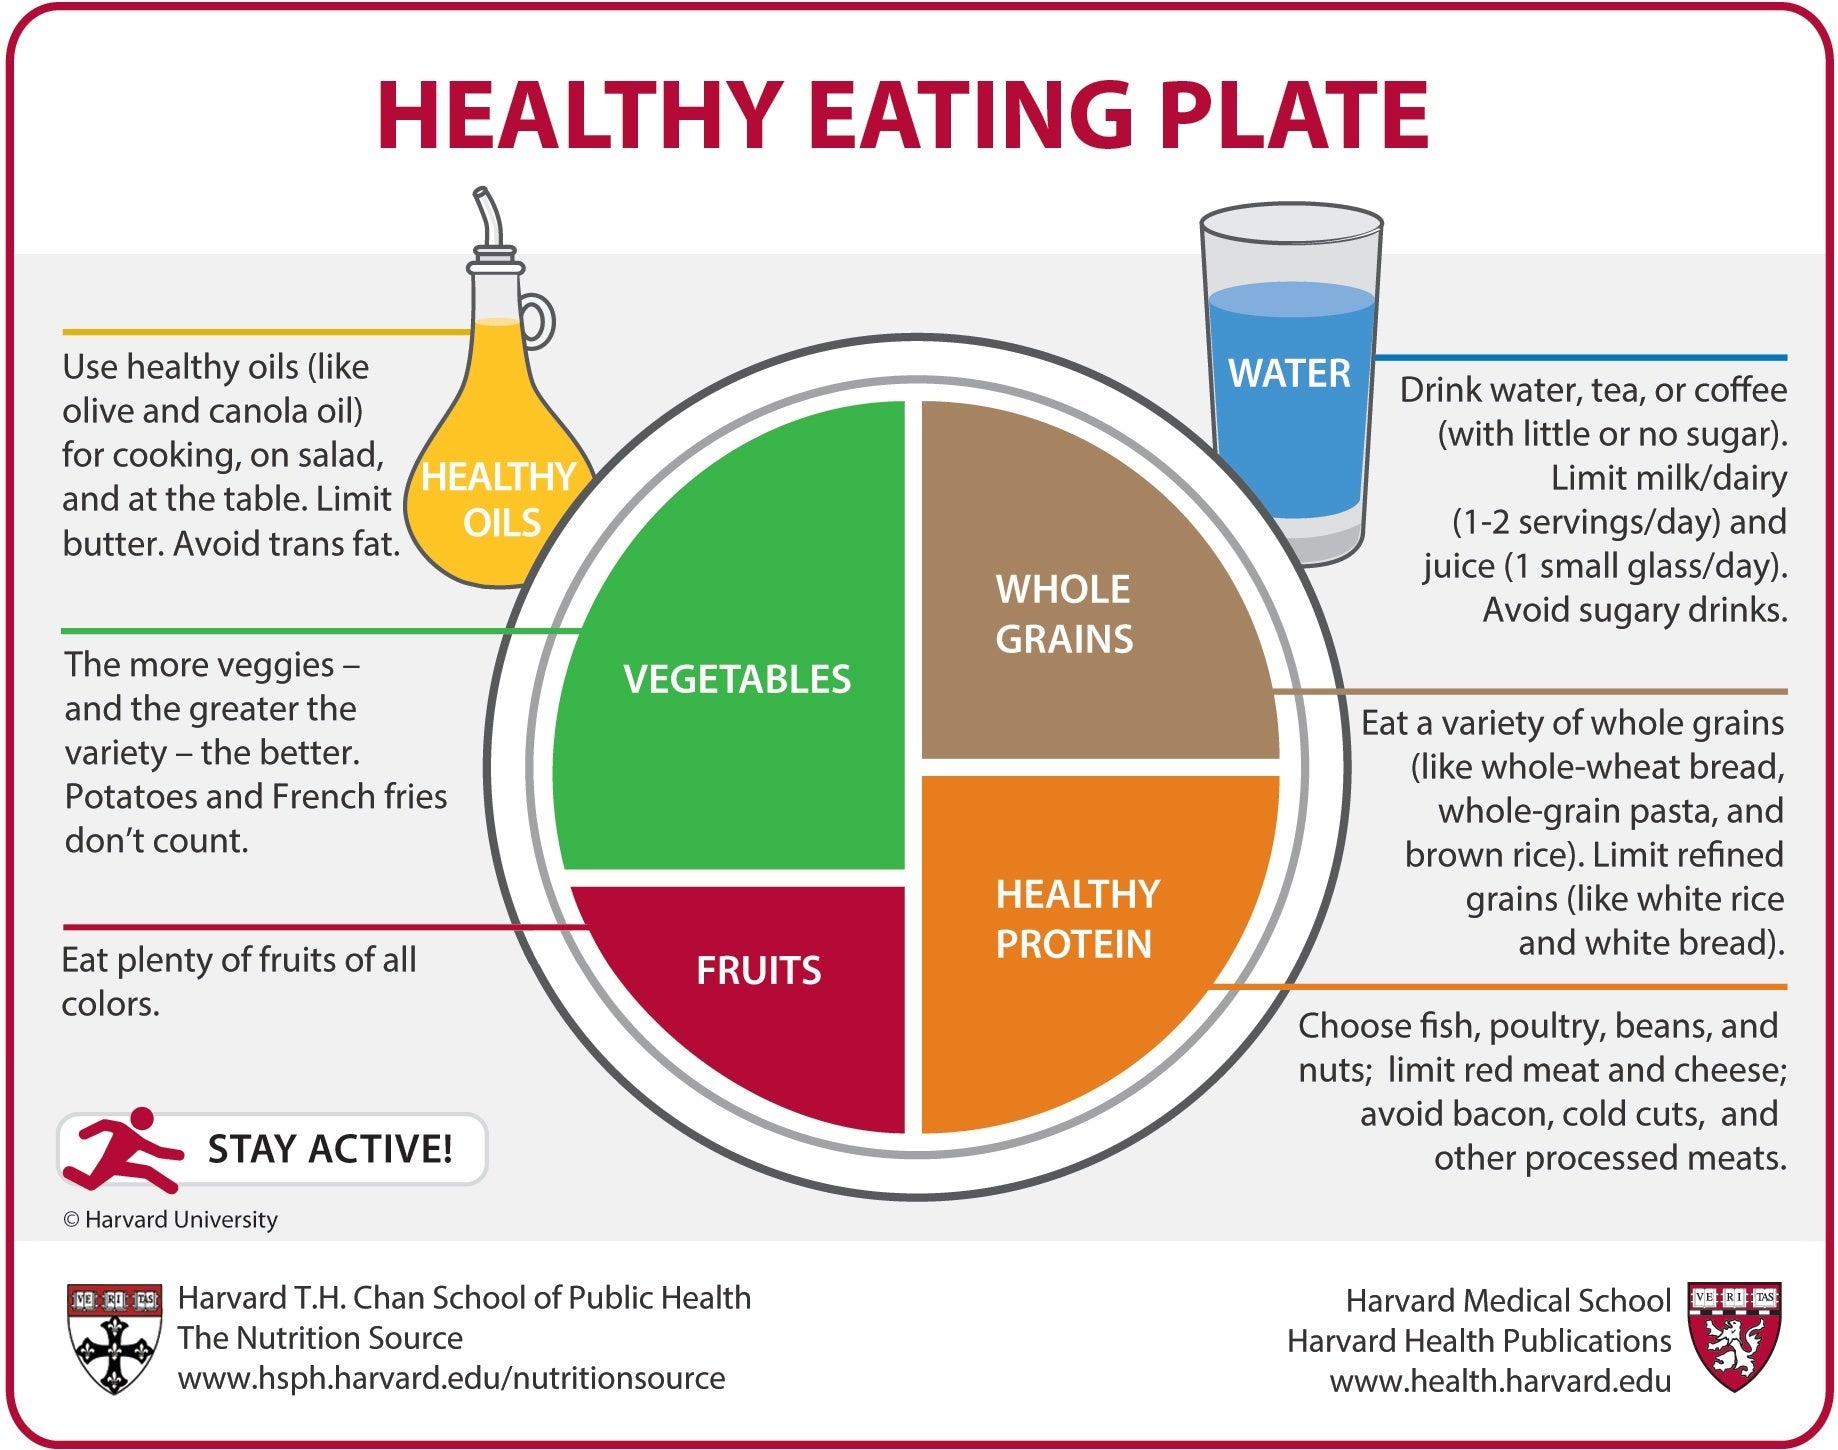
A more practical alternative is Harvard's Healthy Eating Plate. It is similar to MyPlate but with some important updates. It specifies "whole grains" and "healthy" proteins, and includes healthy oils like olive oil [13].

Visually, it makes it easy to see what a balanced meal actually looks like on a plate.
Canada's food plate is another practical visual example that clearly communicates balanced eating—with half the plate devoted to vegetables and fruit, a quarter to whole grains, and a quarter to proteins including plant-based options [14].

References
1. https://www.britannica.com/science/food-pyramid
2. https://www.myplate.gov/resources/graphics/myplate-graphics
3. https://cdn.realfood.gov/DGA.pdf
4. https://pmc.ncbi.nlm.nih.gov/articles/PMC5347101/
5. https://pmc.ncbi.nlm.nih.gov/articles/PMC5872778/
6. https://pmc.ncbi.nlm.nih.gov/articles/PMC6442923/
7. https://pmc.ncbi.nlm.nih.gov/articles/PMC7727026/
8. https://pmc.ncbi.nlm.nih.gov/articles/PMC7539343/
9. https://youtu.be/8OqPdybG7eo?t=418
10. https://cdn.realfood.gov/Scientific%20Report_1.8.26.pdf
11. https://cdn.realfood.gov/Scientific%20Report%20Appendices_1.8.26.pdf
13. https://nutritionsource.hsph.harvard.edu/wp-content/uploads/2012/09/HEPJan2015.jpg


